Reporting and Analytics
ABELDent Standard Reports
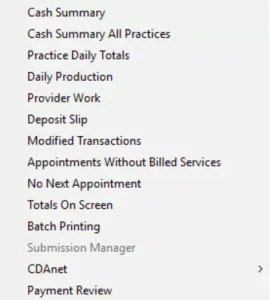
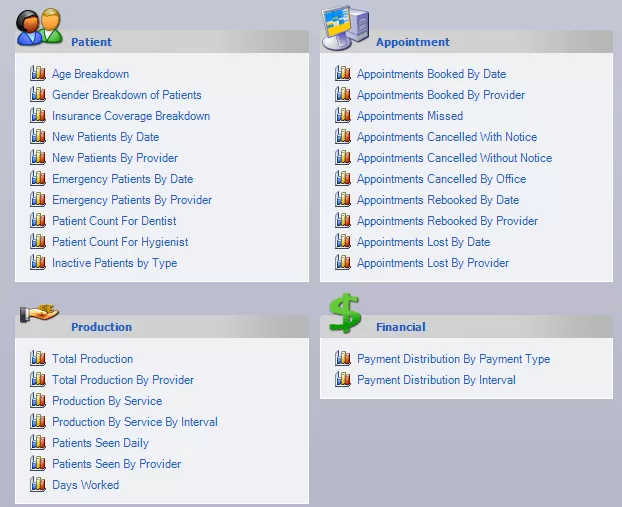
In addition to providing daily practice results, ABELDent helps you track and measure practice productivity in dozens of areas. Monitor practice growth, demographic trends and scheduling efficiency and productivity. Check recall retention, compare production between two time periods, and ensure that you meet collections targets and much more. The standard report menus are shown on the left.
ABELDent Analytics Reports
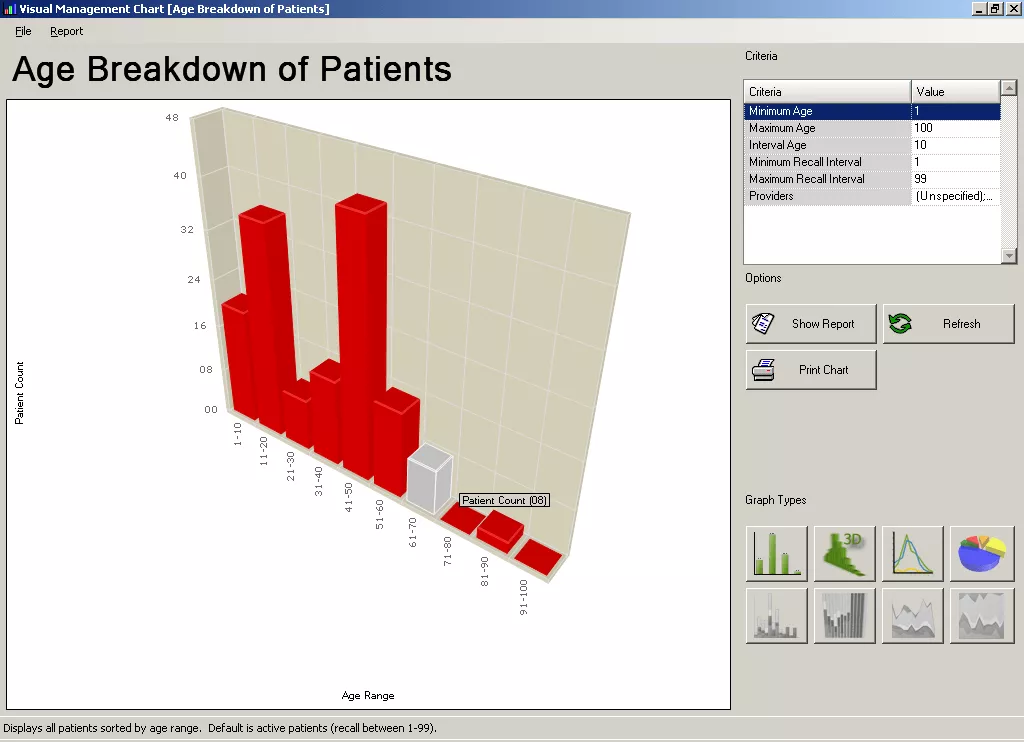
This reporting module produces many Key Performance Indicators (KPIs) to help you make better informed practice management decisions. Results are presented in graphical and tabular form as shown below:
Patient Age Distribution Graph
Report Generator
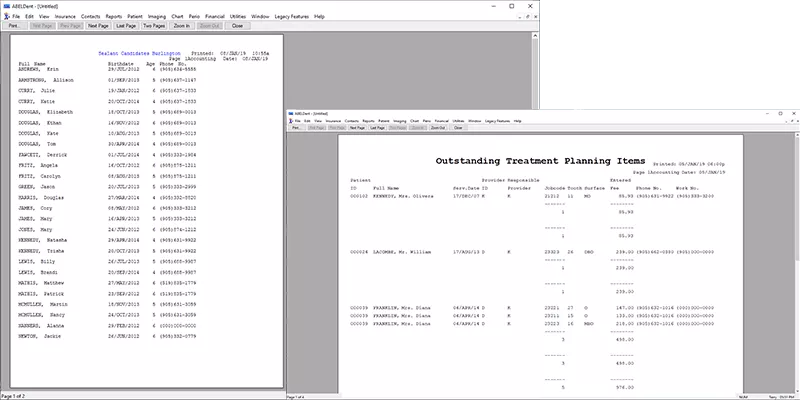
Want to create your own reports? You can with the ABELDent Report Generator by following a few simple steps. ABELDent’s Support Team can also assist you in preparing your own custom reports for your practice if required. And, we can provide you with useful report templates that you can modify if necessary for your own use.
Custom ABELDent Reports with Microsoft Power BI

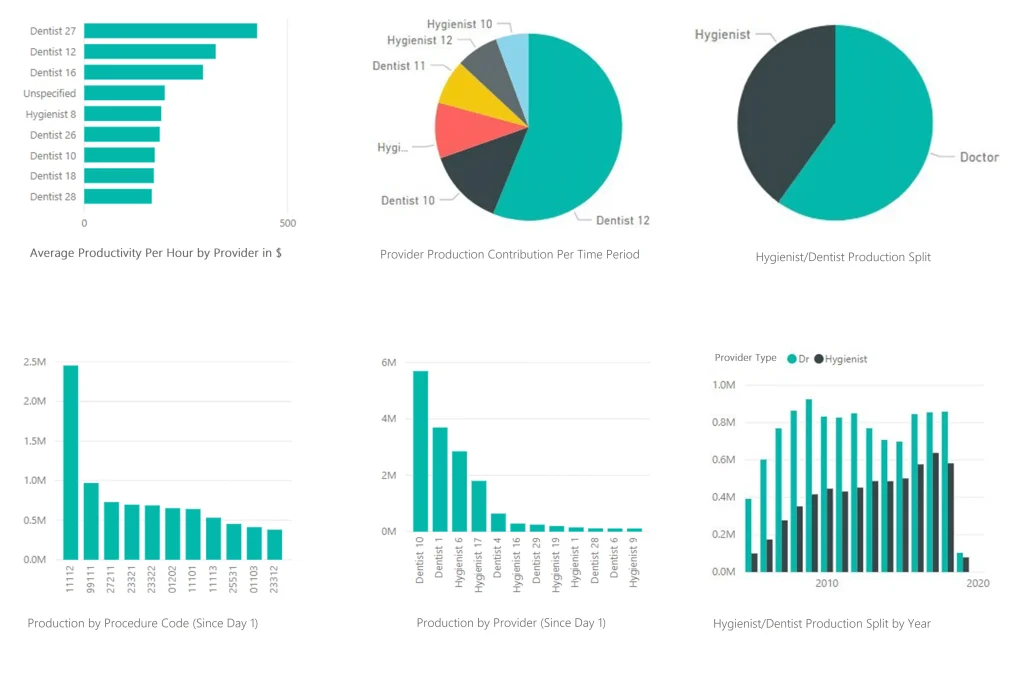
You can now leverage the amazing reporting capabilities of Microsoft Power BI for the production of custom practice reports! Microsoft Power BI is a business analytics platform that monitors and reads important data from applications (such as ABELDent). It provides tools to quickly analyze, transform and visualize data into meaningful reports, key performance indicators (KPIs) and dashboards. In short, Power BI enables more informed practice management decision making. We will work with you to define your specific needs and show you how to use Power BI to extract and format the data you need from the ABELDent database.
